1.
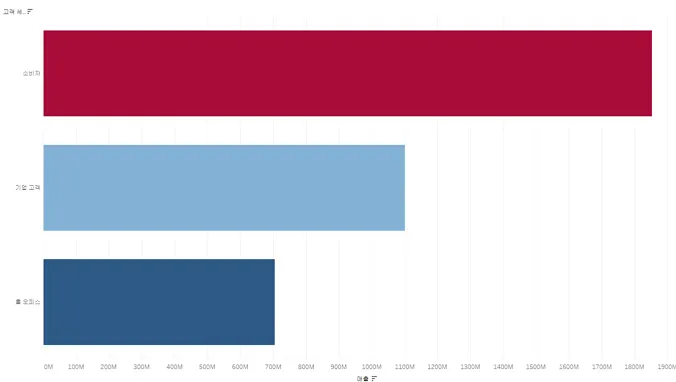
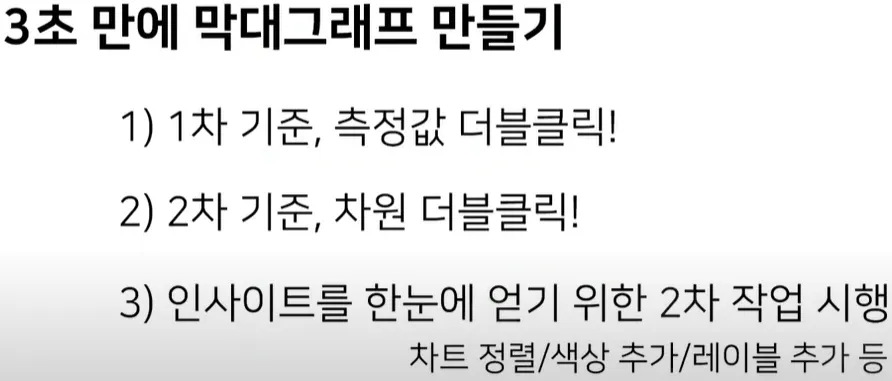
Create a bar chart
막대 차트 만들기
•
2.
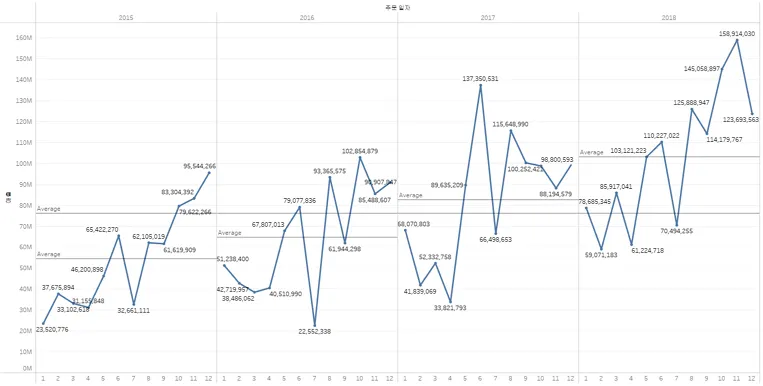
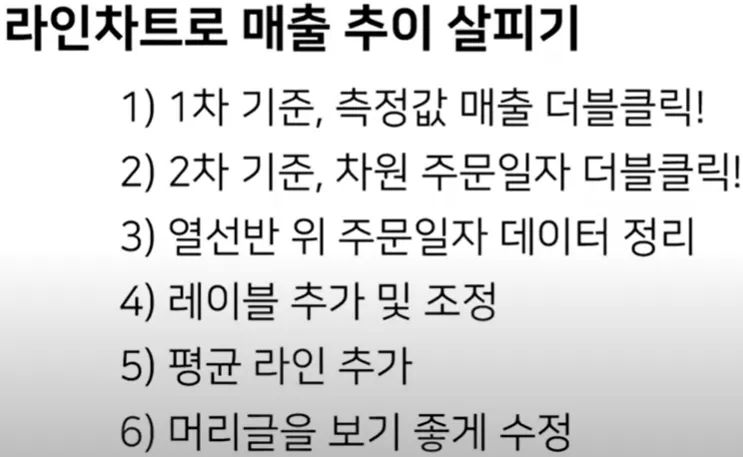
Create a line chart
라인 차트 만들기
•
3.
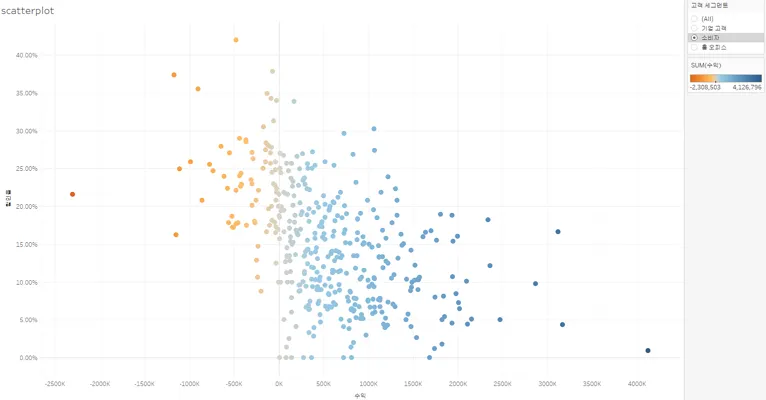
Create a scatterplot
분산형 차트 만들기
•
4.
Create a map using geographic data
지리 데이터를 활용한 맵 만들기
•
•
5.
Create a combined axis chart
결합된 축 만들기
•
•
6.
Create a dual axis chart
이중 축 만들기
•
•
•
•
•
7.
Create a stacked bar
누적 막대 차트 만들기
•
8.
Create a density map
밀도 맵 만들기
9.
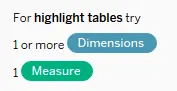
Create a chart to show specific values (crosstab, highlight table)
특정 값을 보여주기 위한 차트 (크로스탭, 하이라이트 테이블)
•
총계를 활용한 크로스탭 만들기
https://www.youtube.com/watch?v=XV9vup02mCc
•
•
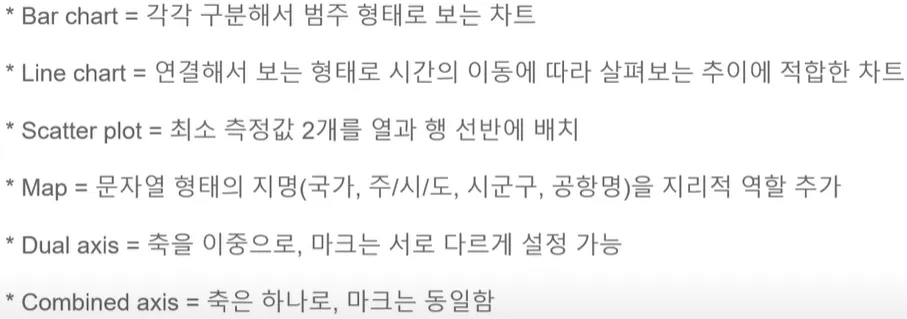
Create a bar chart(막대 차트 만들기)
Create a line chart(라인 차트 만들기)
What steps should be taken to change a vertical bar chart to horizontal?
→ Drag the measure to the columns shelf and the dimension to the row shelf
(Tableau automatically produces a Vertical bar chart when you drag a dimension to the Column shelf and measure to the Row shelf. Hence, to flip a vertical bar chart to horizontal bar chart it is needed to draw Measure to Columns and Dimension to Rows.)
Create a scatterplot(지리 데이터를 활용한 맵 만들기)
You have a scatter plot showing sales and profit by product sub-category. You wish to create a set from a cluster of high values sub-categories. What steps should you take?
→ Click and hold down the mouse, drawing a rectangle to select the sub-categories of interest. Right click and select ‘create set’
Which chart type will best visualize the relationship between two continuous measures?
→ Scatter Plot
What types of trend lines are available in Tableau?
→ Linear, Logarithmic, Polynomial
(While creating Scatter Plot in Tableau, to add a trend line we need to go to the Analytics Pane and then select the trend line and drag it to view the available trend line models and drop it. The available trend line models that are used in Tableau are – Linear, Logarithmic, Exponential and Polynomial. However multinomial is not a type of trend line.)
For Scatter plots, you need at least ______ measures.
→ 2
•
분산형 차트를 언제 그릴수 있냐?
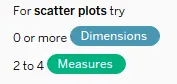

Create a map using geographic data(지리 데이터를 활용한 맵 만들기)
What steps should be taken to create a geographical hierarchy?
→ In the Data pane right-click the geographic field-> Hierarchy -> Create Hierarchy
(In the Data pane, right-click the geographic field, Country, and then select Hierarchy > Create Hierarchy. In the Create Hierarchy dialog box that opens, give the hierarchy a name, such as Mapping Items, and then click OK.)

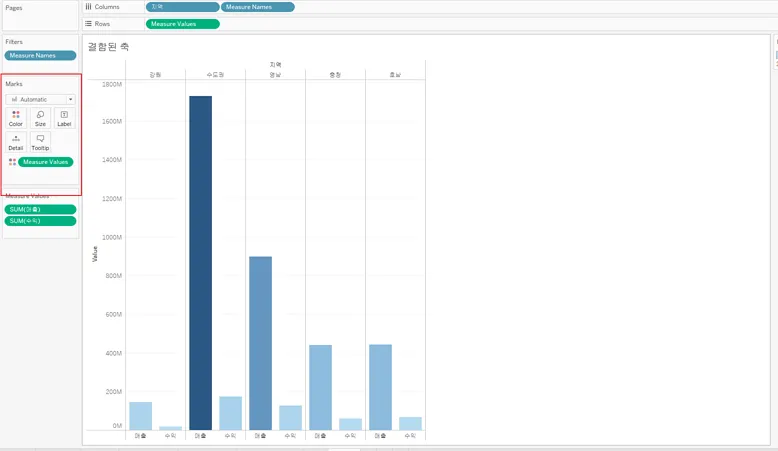
Create a combined axis chart(결합된 축 만들기)
What is the difference between a dual axis chart and a combined axis chart?
→ Dual axis chart creates two independent axes while a combined axis chart merges two or more measures into a single axis.
결합된 축(Shared Axis/Combined Axis)

하나의 축을 공유하는 차트
•
앞에서 다룬 이중 축은 축을 양쪽으로 이중으로 쓰는 반면에,
•
Shared axis는 하나의 축을 공유하는 개념
•
하나의 축을 공유하는 개념이기 때문에 마크를 하나로 해서 비교할 수 있다.

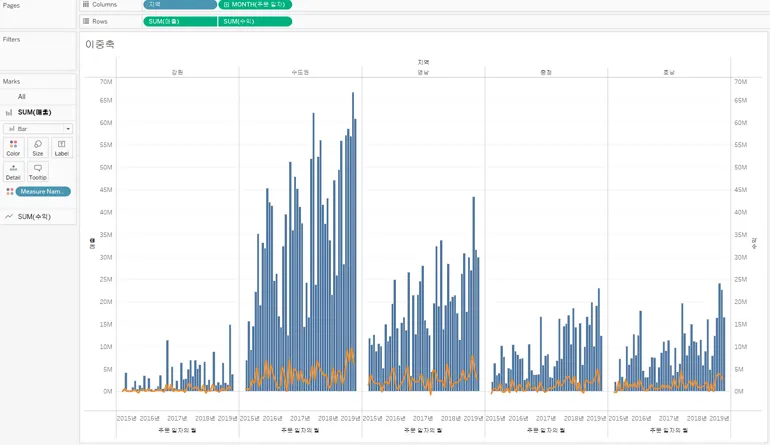
Create a dual axis chart (이중 축 만들기)
You want to create a dual axis chart showing the monthly average “Open” and “Close” values for a stock. The y-axis shows the opening stock price and the x-axis shows the date. What steps should you take?
→ Drag the field “Close” to the row shelf, then select dual lines on the show me menu.
What steps will create a dual axis chart? [Select All that Apply]
→ Drag one dimension to Column and drag two measures to Row -> In the Rows right click any of the measure -> Select Dual axes -> Go to marks type of any of the measure and choose the chart type as Bar
→ Drag one dimension to Column and drag one measures to Row -> drag another measure to the chart itself and as the rectangle shape appears drop it -> Go to marks type of any of the measure and choose the chart type as Bar
이중 축(Dual Axis)
하나의 뷰 안에서 축을 이중으로 써서 만든 차트
•
하나의 뷰 안에서 축을 이중으로 써서 차트를 만드는 경우
•
제한된 공간에서 복수개의 값을 비교해서 보기 위해 많은 경우 사용됨
•
이중 축을 쓸 경우 마크를 서로 동일하게 쓸 수도 있고, 다른 마크를 쓸수도 있음.
•
축을 이중으로 쓴다. 마크를 서로 다른걸로 설정 가능하다. 마크가 각 축마다 나눠져 있다.

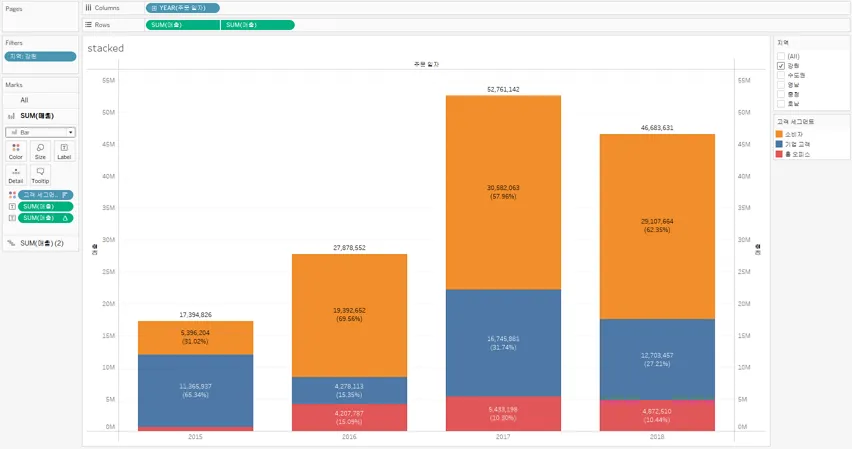
Create a stacked bar(누적 막대 차트 만들기)
How to create a stacked bar chart while using a separate bar for each measure? – [Select All that Apply]
→ Drag a dimension to Color -> Drag Measure Names to Columns and drag Measure Values to Rows -> On the Columns shelf right-click Measure Names -> select Filter -> select the check boxes for the measures to display -> Ok
(To create a stacked bar chart while using a separate bar for each measure we need to follow the steps - Drag a dimension to Color -> Drag Measure Names to Columns and drag Measure Values to Rows -> On the Columns shelf right-click Measure Names -> select Filter -> select the check boxes for the measures to display -> Ok)

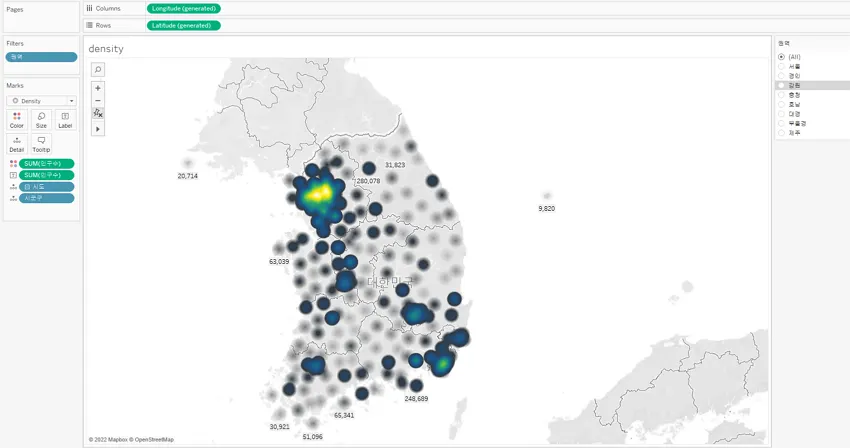
Create a density map (밀도 맵 만들기)
Which of the following applies for Density map in Tableau – [Select All that Apply]
→ To create a density map, the data source should contain Latitude and Longitude coordinates or location names
→ Density maps are most effective when the location data is very precise, such as location coordinates in a limited space
→ Density marks work best where the specific locations change continuously and smoothly across space, rather than values constrained to discrete locations like borough or neighbourhood.
(Explanation: In Tableau to create a density map, the data source should contain Latitude and Longitude coordinates or location names .Tableau can recognize location names and create a density map using the point locations assigned to Tableau geocoding locations, but density maps are most effective when the location data is very precise, such as location coordinates in a limited space. Density marks work best where the specific locations change continuously and smoothly across space, rather than values constrained to discrete locations like borough or neighbourhood.)
After a map is built, if a measure is on color in marks, the map is changed to
symbol map.
→ False
•
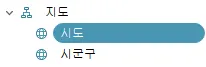
시군구 → County(영문판)
•
시도 → State/Province(영문판)
•
시군구명 중 여러개 시도에 포함되는 경우가 있어 구분하고자 아래와 같이 계층 구조를 만듬.
◦
시군구 차원을 시도 차원에 drag & drop

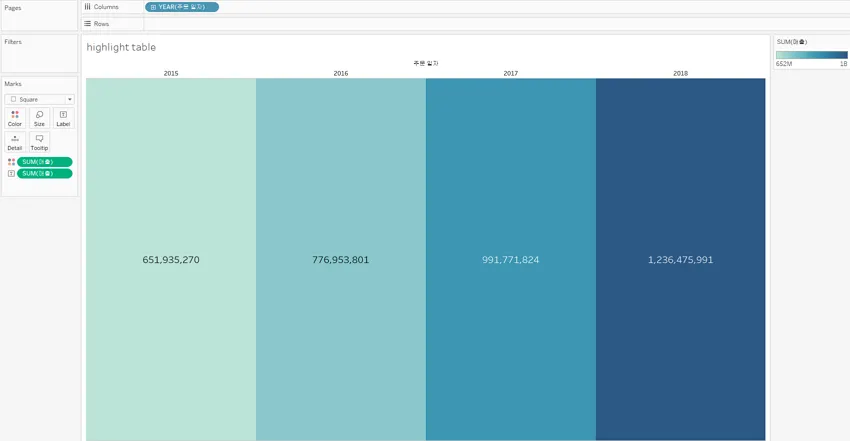
Create a chart to show specific values (crosstab, highlight table) (특정 값을 보여주기 위한 차트 (크로스탭, 하이라이트 테이블))
How to create Highlight Table or Heat Map in Tableau
→ Drag one or more dimensions on the Columns shelf and one or more dimensions on the Rows shelf -> place a measure of interest on the Colour shelf -> Select Square as the mark type
(Explanation: In Tableau, we create a highlight table by placing one or more dimensions on the Columns shelf and one or more dimensions on the Rows shelf. We then select Square as the mark type and place a measure of interest on the Colour shelf.)
crosstab(크로스탭)
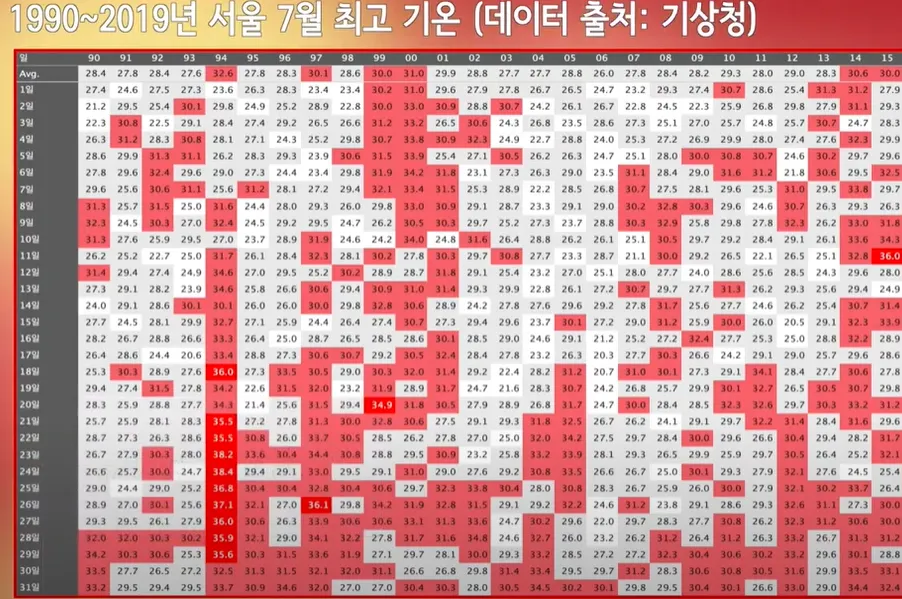

highlight table(하이라이트 테이블)

What does the box in a box plot represent?
→ The range of the middle half of the data points