1.
Add relationships to a data source
데이터 원본의 관계 설정
2.
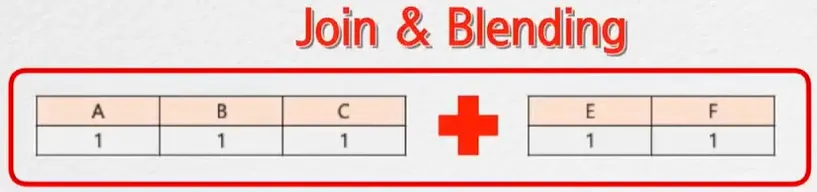
Add joins and unions
조인과 유니온
•
•
•
3.
Explain when to use a join versus a relationship
조인 vs 관계 사용에 대한 설명
Add relationships to a data source(데이터 원본의 관계 설정)
You wish to avoid data duplication when combining tables with different granularity.
Relationshiops are created in the logical layer.
Which of the following are reasons to use a join rather than a relationship?
→ To create an extract using the denormalized table
Relationships are added in which layer?
→ The logical layer
To ensure that all values from both tables in the relationships are included, you can
→ Add a measure to the view
Advantage
→ Make your data source easier to define, change, and reuse
→ Only query data from tables with fields used in the current viz.
Advantages to using relationships to combine tables
→ Make it easier to analyse data across multiple tables at different levels of granularity
→ Tables are only queried when fields from the tables are added to the viz.
In a Relationship we need to define the following Join type:
→ Inner Join
→ Left Join
→ Right Join
→ It is not required to define a join type in a relationship. (O)

1.
Drag a table to the canvas.
2.
Drag another table to the canvas. When you see the "noodle" between the two tables, drop that table.
3.
Add more tables following the same steps, as needed.

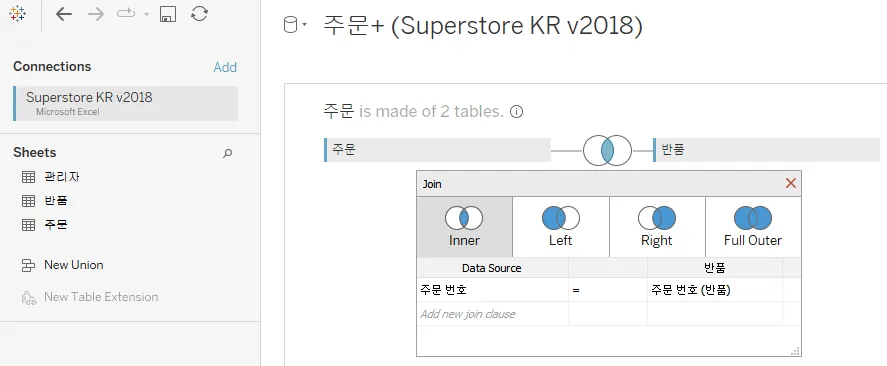
Add joins and unions(조인과 유니온)
조인(Join)
In which of the following situations would an outer join be preferred to a blend?
→ when you need to include all rows from both tables, even when the join or blend criteria is not met
This type of join will include all values from the left table:
→ Left
When you use a full outer join to combine tables, the result is a table that contains all values from both tables.

•
Tableau Desktop의 기본 방법은 관계를 사용하는 것입니다. 관계는 정보를 결합할 때 원래 테이블의 세부 수준을 유지합니다. 또한 관계를 사용하면 컨텍스트 기반 조인을 시트별로 수행할 수 있으므로 각 데이터 원본을 더 유연하게 사용할 수 있습니다. 관계는 대부분의 경우 데이터를 결합하는 데 권장되는 방법입니다. 자세한 내용은 관계가 조인과 다른 점을 참조하십시오.
그러나 제어를 위해서나 관계에 비해 나은 조인의 특성(예: 의도적인 필터링 또는 복제) 때문에 조인을 직접 설정하려는 경우가 있을 수 있습니다.
•
데이터를 열 기준으로 붙임…
유니온(Union)
When creating a union between tables, what will happen if the field names do not match?
→ Fields in the union that do not have matching field names will contain null values.
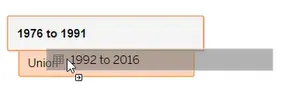
Which describes how to create a union of two tables?
→ On the data source page, drag the first table into the canvas. Then drag a second table
onto the canvas, below the first table.
→ On the data source page, double-click the “New Union” icon. A Union menu will appear.
Drag both tables to the Union menu, then click OK.
"If corresponding fields between tables have different names, you can use union recommendations, manually merge fields in the Mismatched Fields list, or rename the field in the union profile to merge the mismatched fields together.
Which option leads to adjusting the granularity of data in Tableau?
→ Aggregate
→ Group by
→ Grouped Fields
→ Extract


•
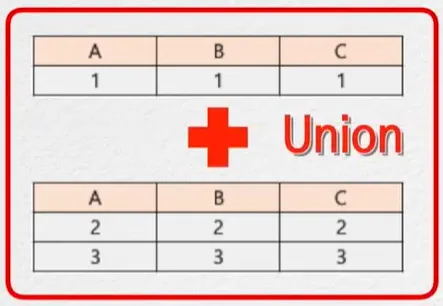
데이터를 유니온으로 통합하면 한 테이블의 값(행)을 다른 테이블에 추가하여 두 개 이상의 테이블을 결합할 수 있습니다. Tableau 데이터 원본의 데이터를 유니온하려면 테이블이 동일한 연결을 사용해야 합니다.
최상의 결과를 얻으려면 유니온을 사용하여 결합하는 테이블의 구조가 같아야 합니다. 그러므로 각 테이블의 필드 수가 같고 관련 필드의 필드 이름과 데이터 유형이 일치해야 합니다.
•
데이터를 행 기준으로 붙임.
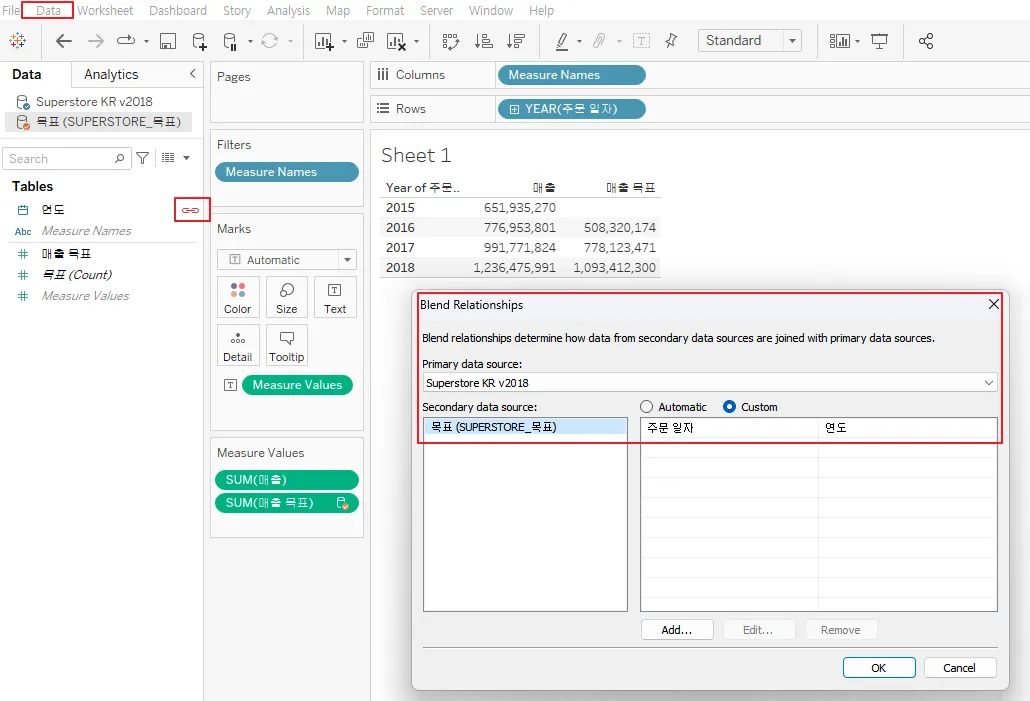
데이터 통합(Data Blending)
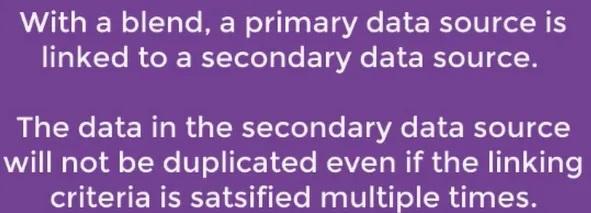
Which of the following uses a primary and secondary data source?
→ Data blending involves a primary and secondary data source.
When we do the blend and try the view the data in the viz, why does it only shows data from the primary data source?
→ A join combines two tables into a single larger table, so if you do a join and then look at the full data in the viz, you will see the table that combines the two (or more) tables that you have joined.
A blend doesn't create a combined table. The Tableau documentation explains, "Unlike joins, data blending keeps the data sources separate and simply displays their information together.... Each data source is queried independently and the results are aggregated to the appropriate level then visualized together."
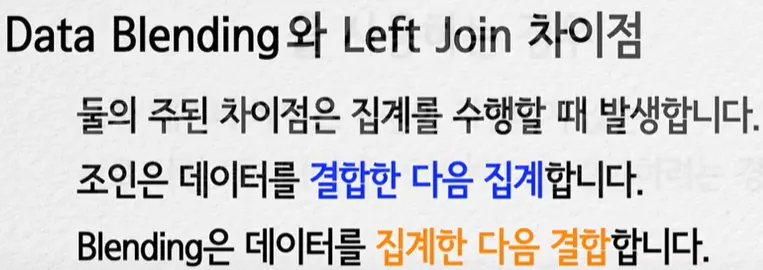
In other words, with a join, the query combines the tables before Tableau aggregates the results in the view, whereas with a blend the aggregation happens before the results are combined.
Data blending simulates a traditional left join. The main difference between the two is when the aggregation is performed. A join combines the data and then aggregates. A blend aggregates and then combines the data.
How many data sources can we blend in Tableau?
→ Two
If there are duplicated data, then use?
→ Blending
•

•
Data Blending와 Left Join 차이점
•
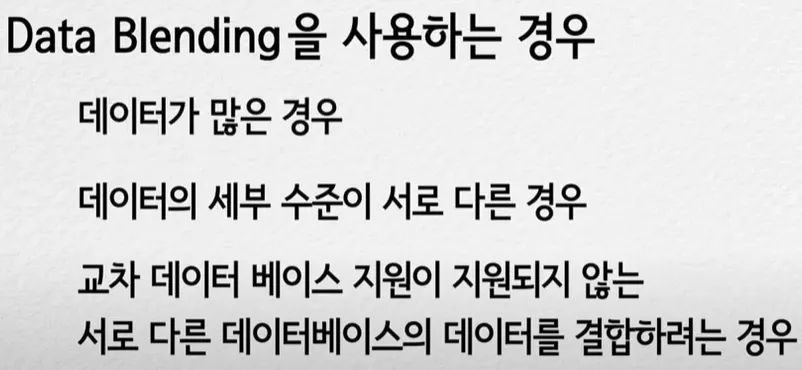
Data Blending을 사용하는 경우
•
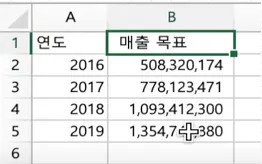
예> 주문 데이터와 매출 목표 데이터 연계